Tuesday, June 12, 2018

Housing Finance & Realty Sector Updates


Housing Finance & Realty Sector cos. Mainly engaged in Affordable Housing sector is Gaining  teeth slowly. Though rising interest rates will affect their PAT in coming days, but the Opportunities ahead is exponential.  Reality market has started recovery. Stocks related to these sectors are now available at a Reasonable Valuations. We are expecting an up-move in short term.
Join Us at   WhatsApp:    1. https://chat.whatsapp.com/6LfcMS38vjdFt5xYGwS73J ( Free )
                                            2. https://chat.whatsapp.com/8sR3MYOXvSFIIa56Tc7Ush  (Premium )
                                            $$$  We are active at Twitter #  NIFTYNEXT1
Monday, June 11, 2018

Sanghi Industries Ltd ( SANGHIIND ) – Managements View & Valuations


Managements View : *Cement prices steady in April & May 2018 vs Q4FY18
*Expect a regular cement price cut of 3%/5% during monsoon
 *FY19 tgt vols=3.2mt & EBITDA exp at apprx 900/tn
 *Blended costs of borrowing down to 10.75% vs 15.5% earlier
 *Capacity wil double by March 2020
( Source : CNBCTV18 )
Valuations :  Sanghi Industries Ltd is now Trading at  2.3X of its EPV ( March 2018 earnings ). Its 10 years avg. long term EPV comes at 3.3X, which translates its effective price at 123.50. It has  Net Cash / Share of 0.70.  Market Cap / Networth is 1.9X.
Financials :    https://www.screener.in/company/SANGHIIND/
Disclaimer : We are / may going to take exposure shortly.
Join Us at   WhatsApp:    1. https://chat.whatsapp.com/6LfcMS38vjdFt5xYGwS73J ( Free )
                                            2. https://chat.whatsapp.com/8sR3MYOXvSFIIa56Tc7Ush  (Premium )
                                            $$$  We are active at Twitter #  NIFTYNEXT1

Sunday, June 10, 2018

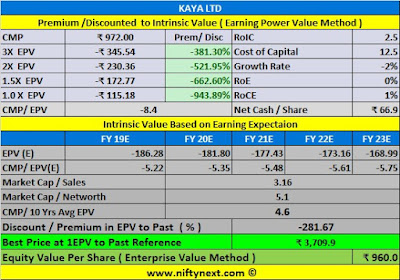
Kaya Ltd ( KAYA ) – Valuations


KAYA closes   at ₹ 972.95   with  a  Gain  of     +9.2%   on    08-June- -2018   with formation of  a  Long Green Candle    on Daily  Price Chart.  
Valuations :  Sales has declined to 97.38Cr by -2.94% in Q4 FY 2017-18 & Losses has inched higher to -7.84 Cr. By-102%.
Kaya Ltd  is now Trading at -8.4X of its EPV ( March 2018 earnings ). Its 10 years avg. long term EPV comes at 4.6x, which translates its effective price at 3709. It has  Net Cash / Share of 66.90.  Market Cap / Networth is 5.1X. Raw Material Consumed has increased by+38% to 9.99 Cr & Stock has Adjustments of  -0.15 Cr ( In previous Quarter YoY it was 5.11Cr ). R&D Expenses is Zero in the last FY 2017-18 while Employee Expenses is 35.77 Cr declined by -3% QoQ.
Disclaimer : We are / may going to take exposure shortly.
Join Us at   WhatsApp:    1. https://chat.whatsapp.com/6RaxJrOD5UzFi1uw0hgBCo  ( Free )
                                            2. https://chat.whatsapp.com/8sR3MYOXvSFIIa56Tc7Ush  (Premium )
                                            $$$  We are active at Twitter #  NIFTYNEXT1

Disclaimer

The recommendations made herein do not constitute an offer to sell or a solicitation to buy any of the securities mentioned. No representations can be made that the recommendations contained herein will be profitable or that they will not result in losses. Readers using the information contained herein are solely responsible for their actions. Information is obtained from sources deemed to be reliable but is not guaranteed as to accuracy and completeness. The above recommendations are based on the theory of Technical Analysis and do not reflect the fundamental validity of the Scrip. www.niftynext..com does 't take any Responsibility for any losses arising from using the Stocks Recommendations.
We( WWW.NIFTYNEXT.COM) are not Registered with Any Regulatory Body in India ie SEBI,NSE,BSE,AMFI or Any Otheres.


Blog Archive